Platform design.
Website design.
Branding.
Overview
Meridian is where you buy and sell shares, options and futures — all of it from one account, one buying power, three currencies.
In Canada, holding shares and holding options means holding them at two different brokers. Money sits in the account you are not trading from, the cost base lives in a spreadsheet, and anything bought in another currency is converted twice at a rate nobody shows you.
And all of those platforms look the same: a wall of numbers and blinking widgets, built for someone who trades for a living. Meridian is not for that person. It is for someone who owns a few things and wants to know they are fine.
The expectations
Not because something is wrong. Because looking at it is a pleasure — the way you open an app you like for no reason at all.
Checking a balance, reading a chart, placing an order. Chores everywhere else. Here each one should land as something.
The person opening it is not trading all day. They want to know their money is fine within a second, and close it still feeling that way.
Jarvis from Iron Man, not a Bloomberg terminal. Dark, quiet, every move smooth as butter.
The brief, in one line
Dashboard
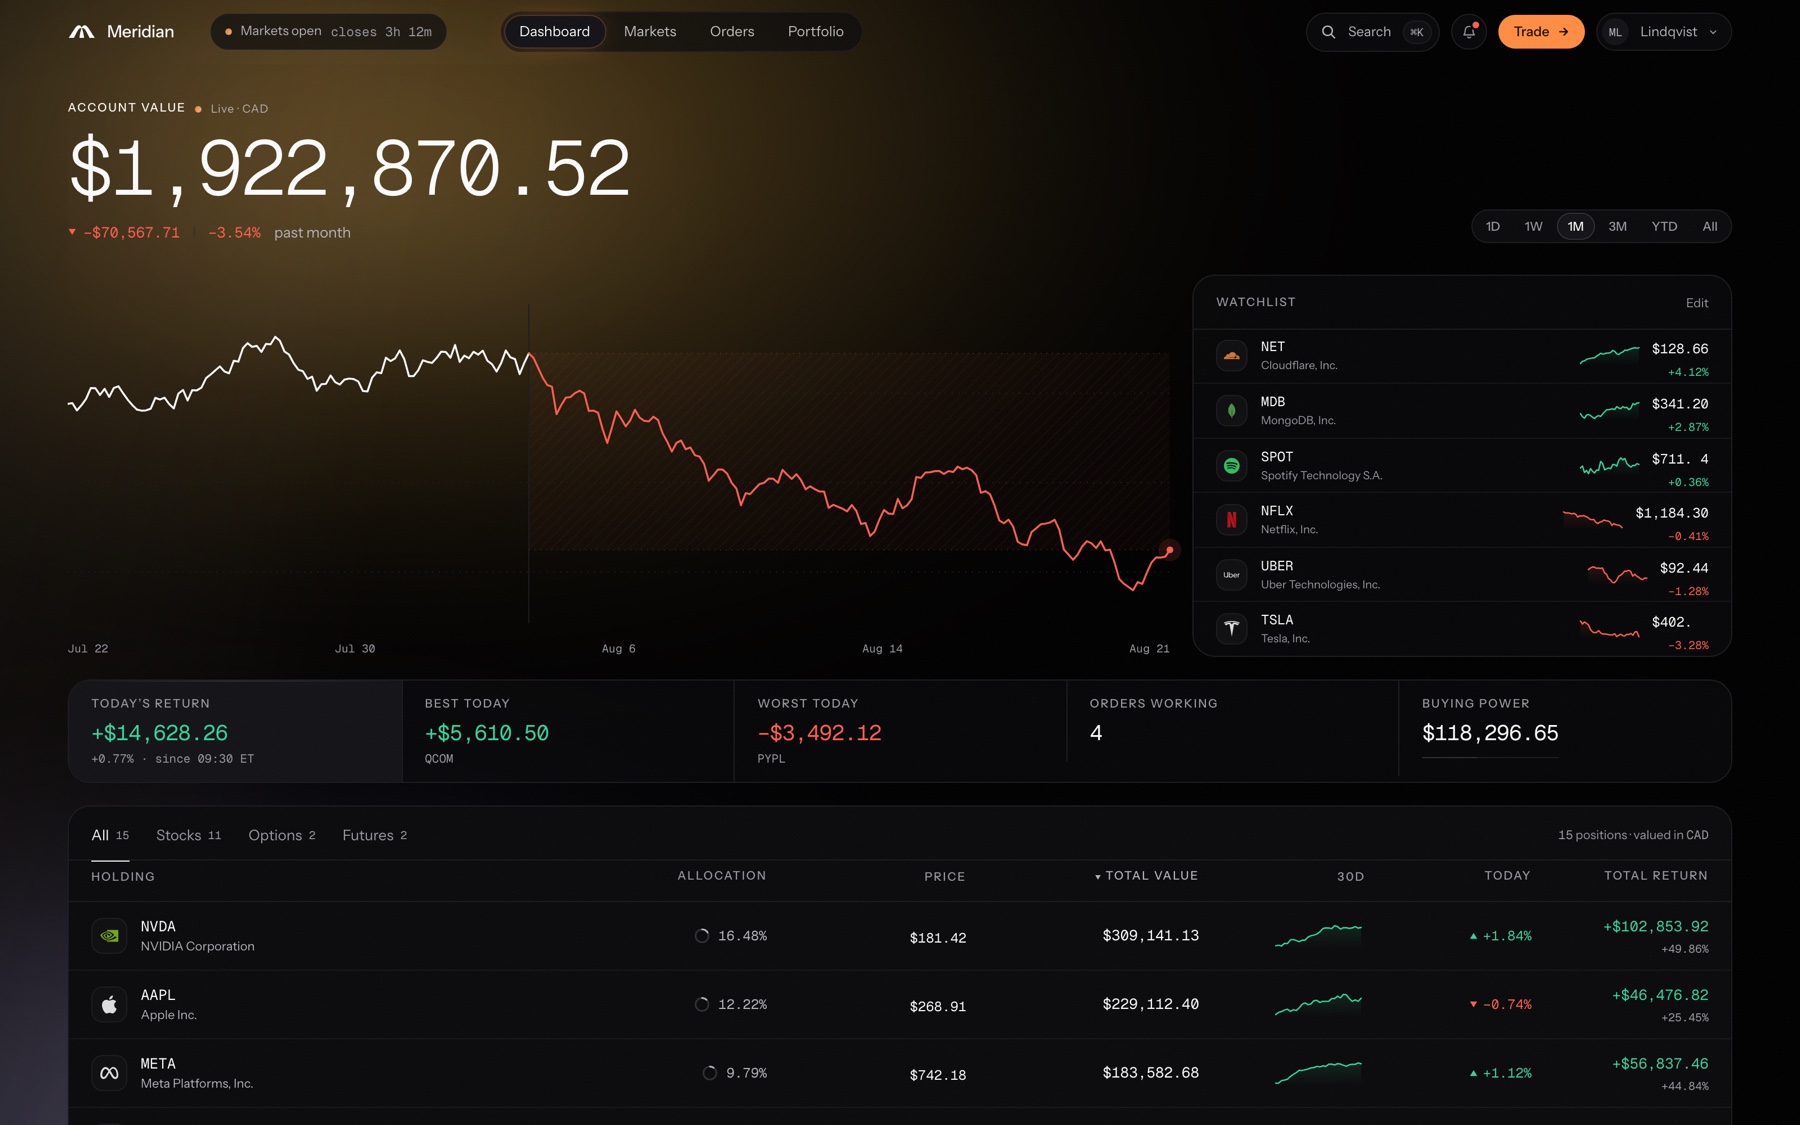
This is the screen you open, and it owes you an answer before you have read anything: what everything is worth, and whether it is going up or down. One number, one line, one delta. Nothing else on the screen asks for attention.
Everything past that answer waits until you ask for it. Change the range and the whole headline recalculates. Drag across the frame and the number becomes the value on that day, date and delta following the cursor — reading history is the same gesture as looking at it. Try it: the chart below is the product’s, running on this page.
Quiet on the surface, dense underneath. Under the positions table sit three panels, each one answering a question you would otherwise go looking for.
The watchlist. What am I watching? Six instruments on hairline sparklines, each one click from its page and two from a filled ticket.
Recent activity. What happened while I was gone? Fills, dividends, a deposit, a contract expiring — in words, newest first.
Open orders. What is still working? Every resting order with a fill bar under it — 60 of 200 done, good till cancelled — so nothing is working on your behalf without you knowing.
Markets and orders
Two pages carry the rest of the day. One is where you go looking for something to buy or sell. The other is where you go to see what became of it.
Markets
Every instrument the platform carries — 34 of them across seven exchanges — in one table: the live price, the day’s move, a thirty-day line and the 52-week range on every row. Narrow it to stocks, ETFs or futures, type into the filter, or click a sector to leave only that sector standing. Open a row and the instrument’s own page comes in over the table rather than taking you somewhere else.
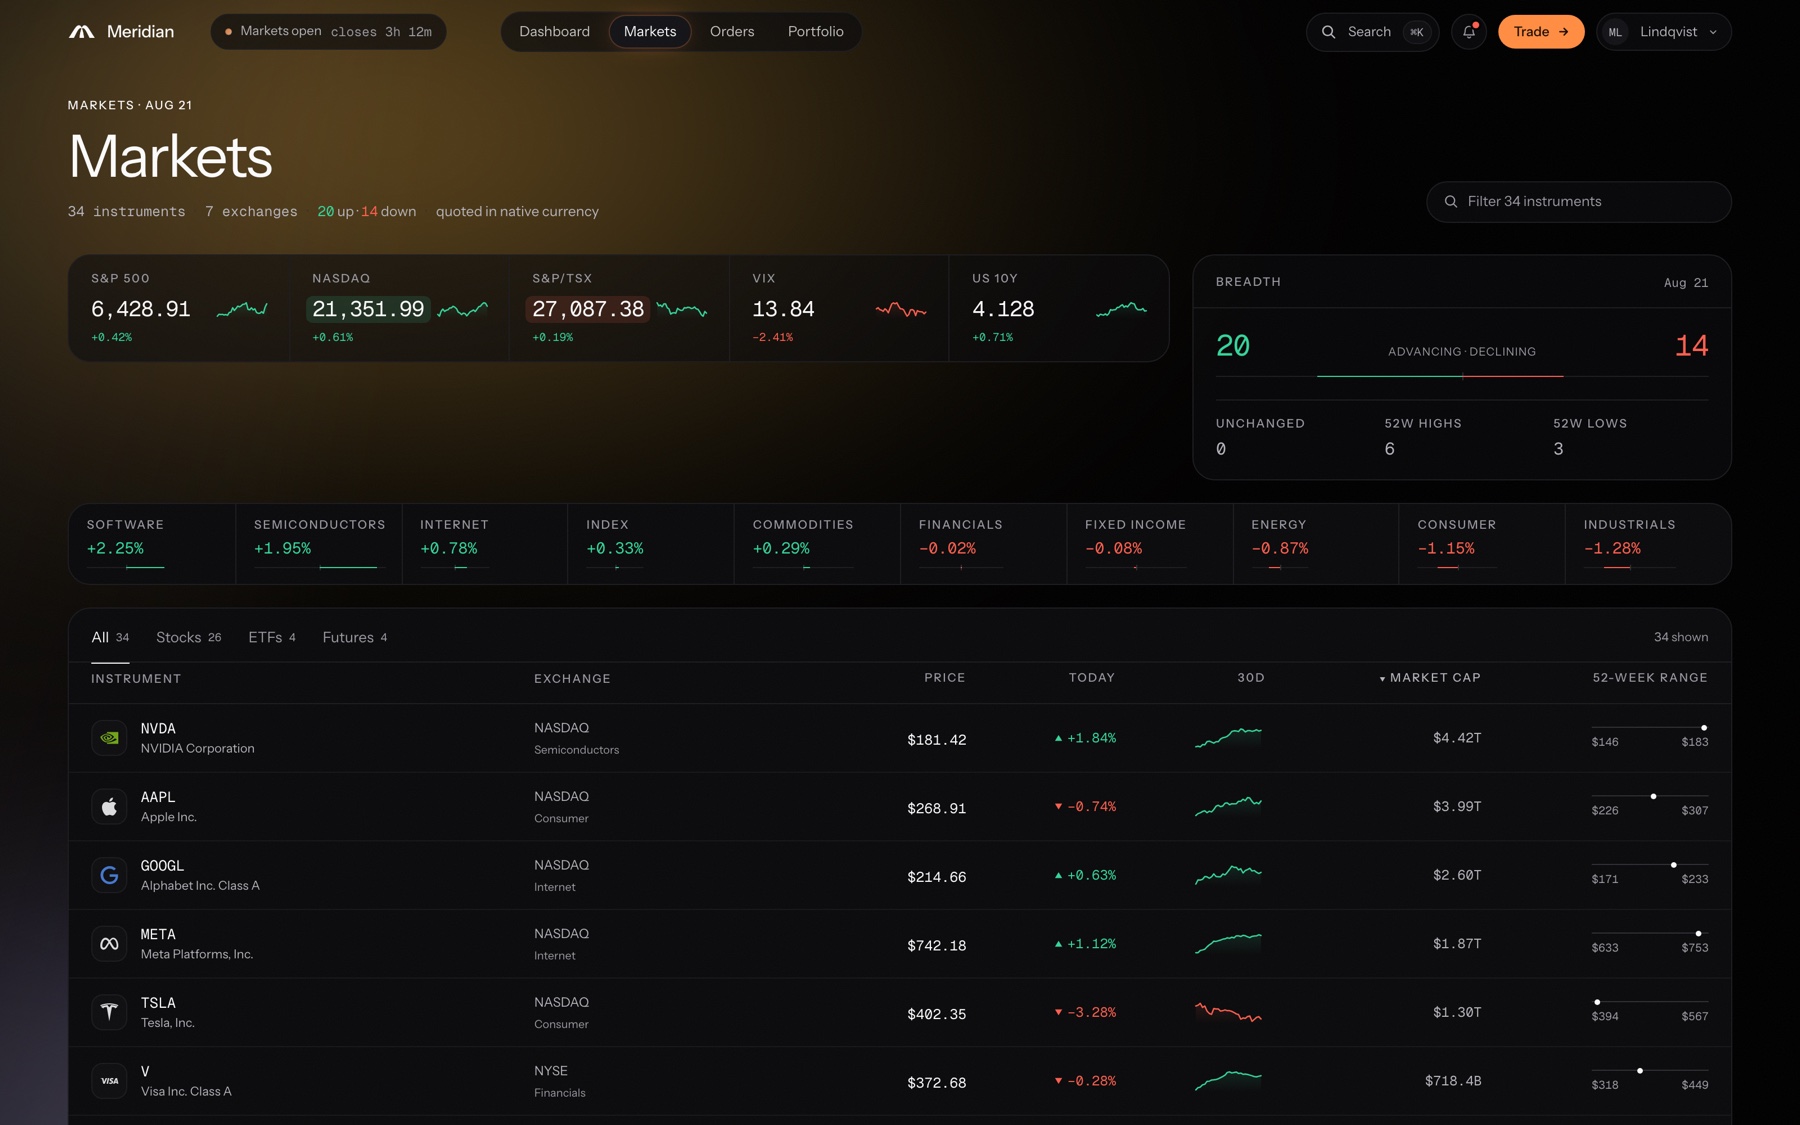
Movers. Under the table, the day’s extremes without sorting anything for them — gainers, losers and most active, one tap apart.
Orders
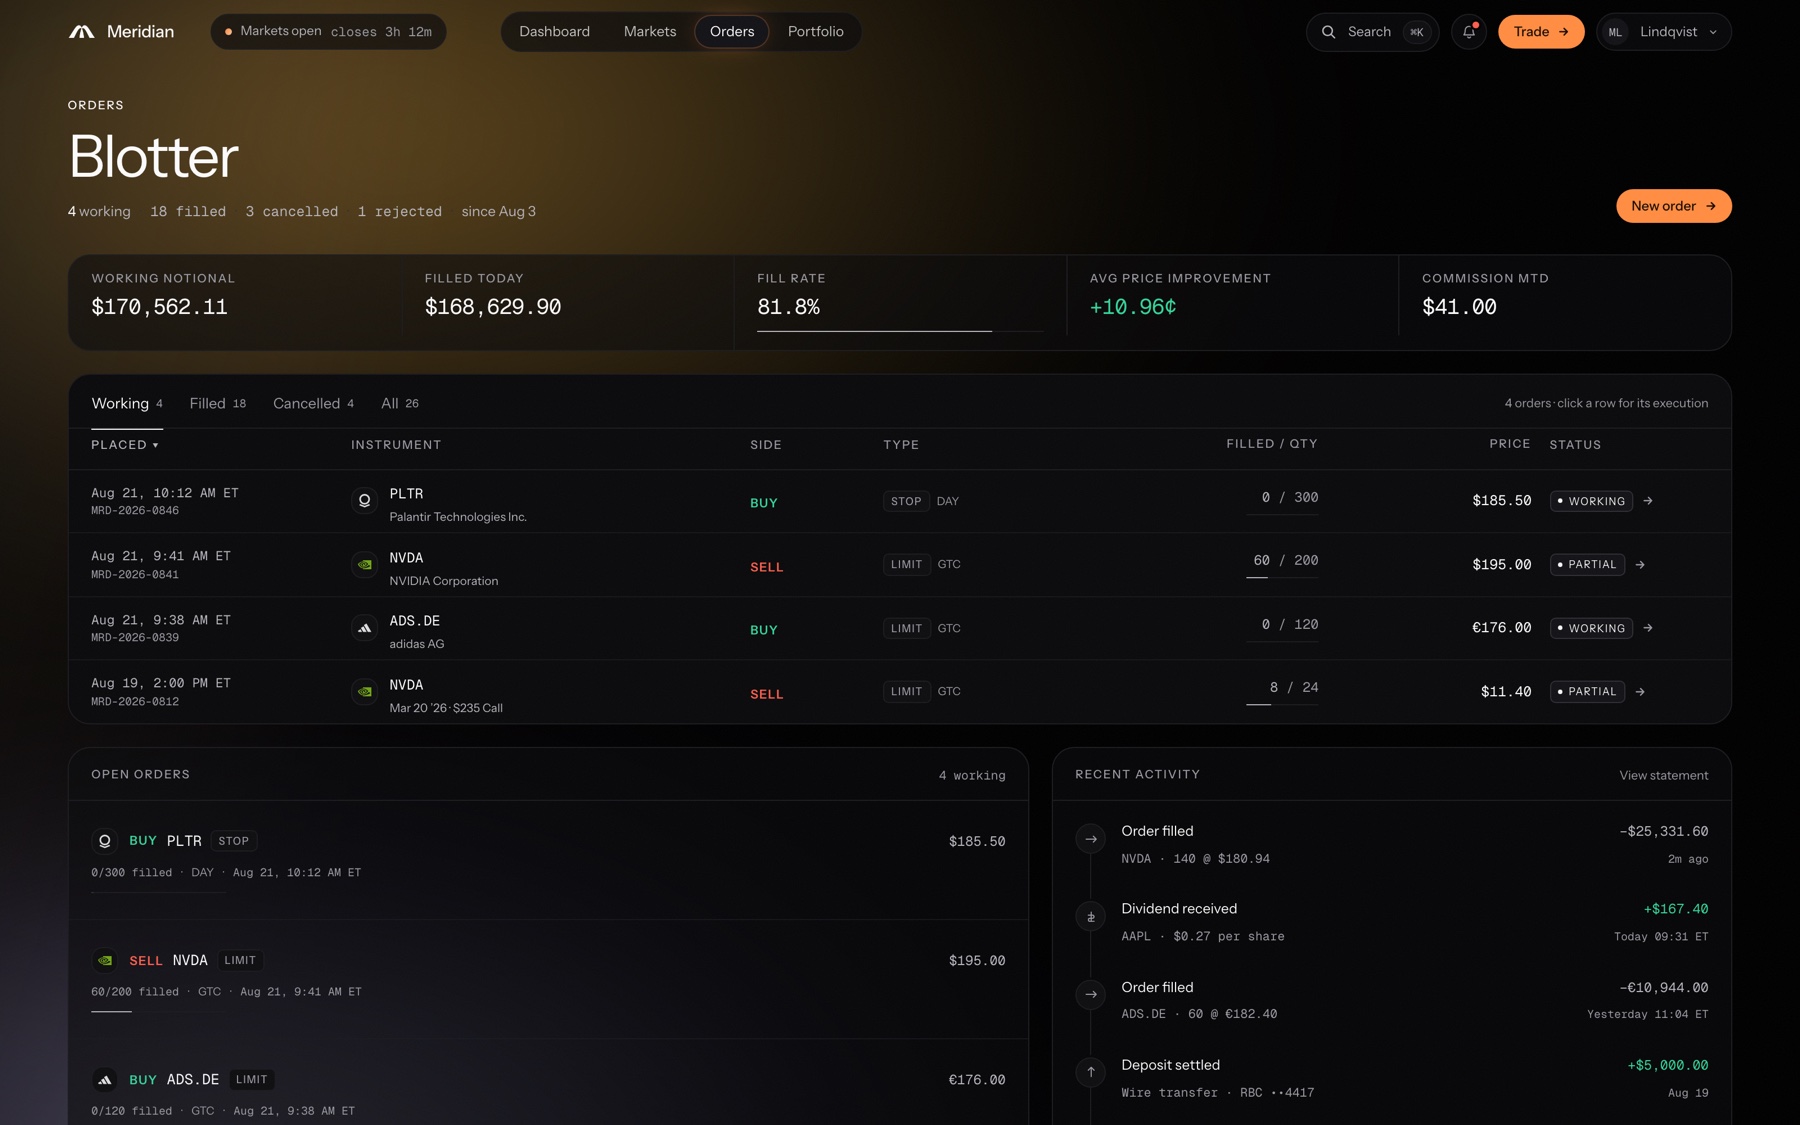
Orders is where you check on what you have already done. Every order in one blotter, sorted by what happened to it — still working, filled, cancelled — with the count on each tab, and above them the numbers that belong to whoever placed them: what is working, what filled today, how much of it filled, how much better than the reference price, and the month’s commission.
Portfolio
Portfolio is the page for what you actually hold. What the whole thing is worth right now at the top, its return drawn against the S&P 500 beside it, and an allocation you can cut four ways — by asset class, by sector, by currency, or one position at a time. It is the same holdings the dashboard reads, regrouped rather than authored again.
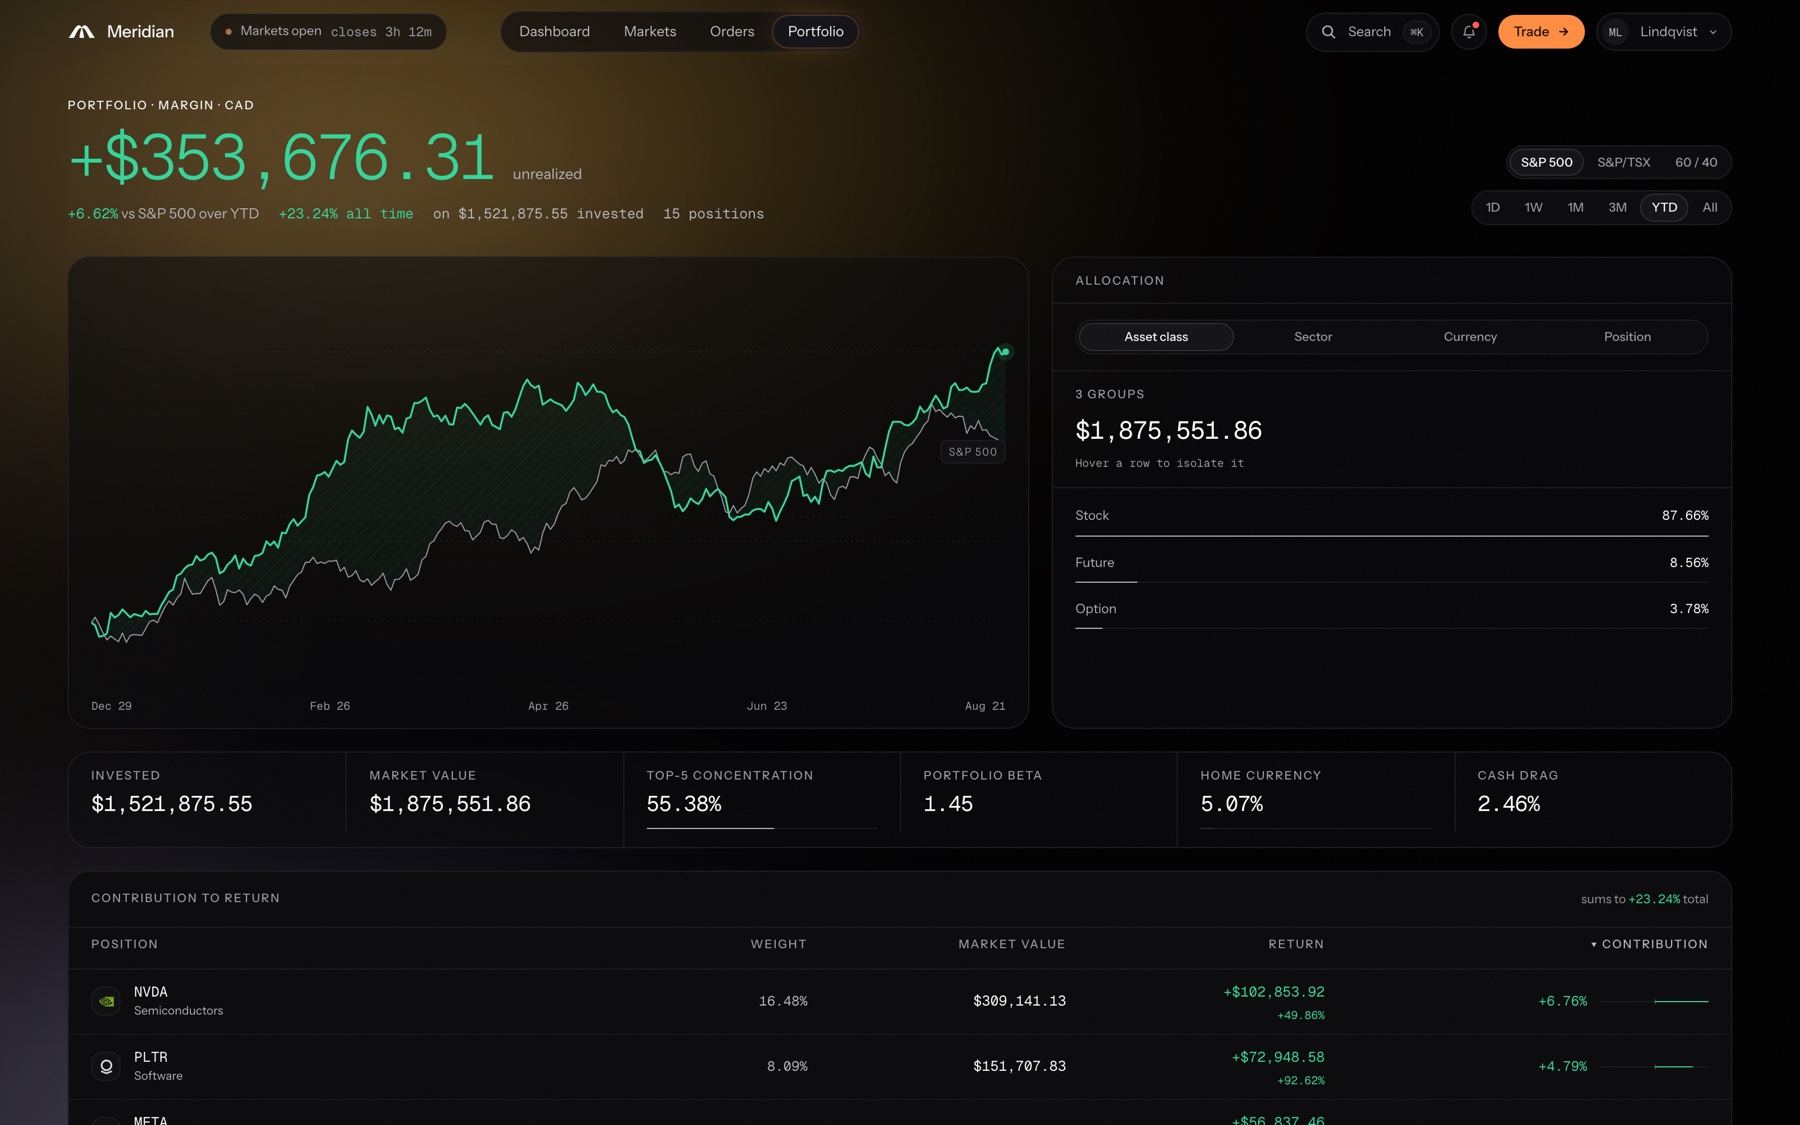
Under it, the rest of the answer: what the money is in, what each of those has done for you, and what the whole thing pays you while you hold it.
Allocation. One total, four cuts. Asset class, sector, currency or position — and hovering a row isolates it.
Dividend income. What holding it pays you: twelve months of it, and the next payments already dated.
Contribution to return. Every position you own, ranked by how much of the return it actually made — weight, market value, return, and its share of the total.
Search
⌘K opens the command palette from any screen — every route and all 34 instruments in one list. It is the only component in the system allowed a shadow, because it is the only one that genuinely floats.
Moment of trading
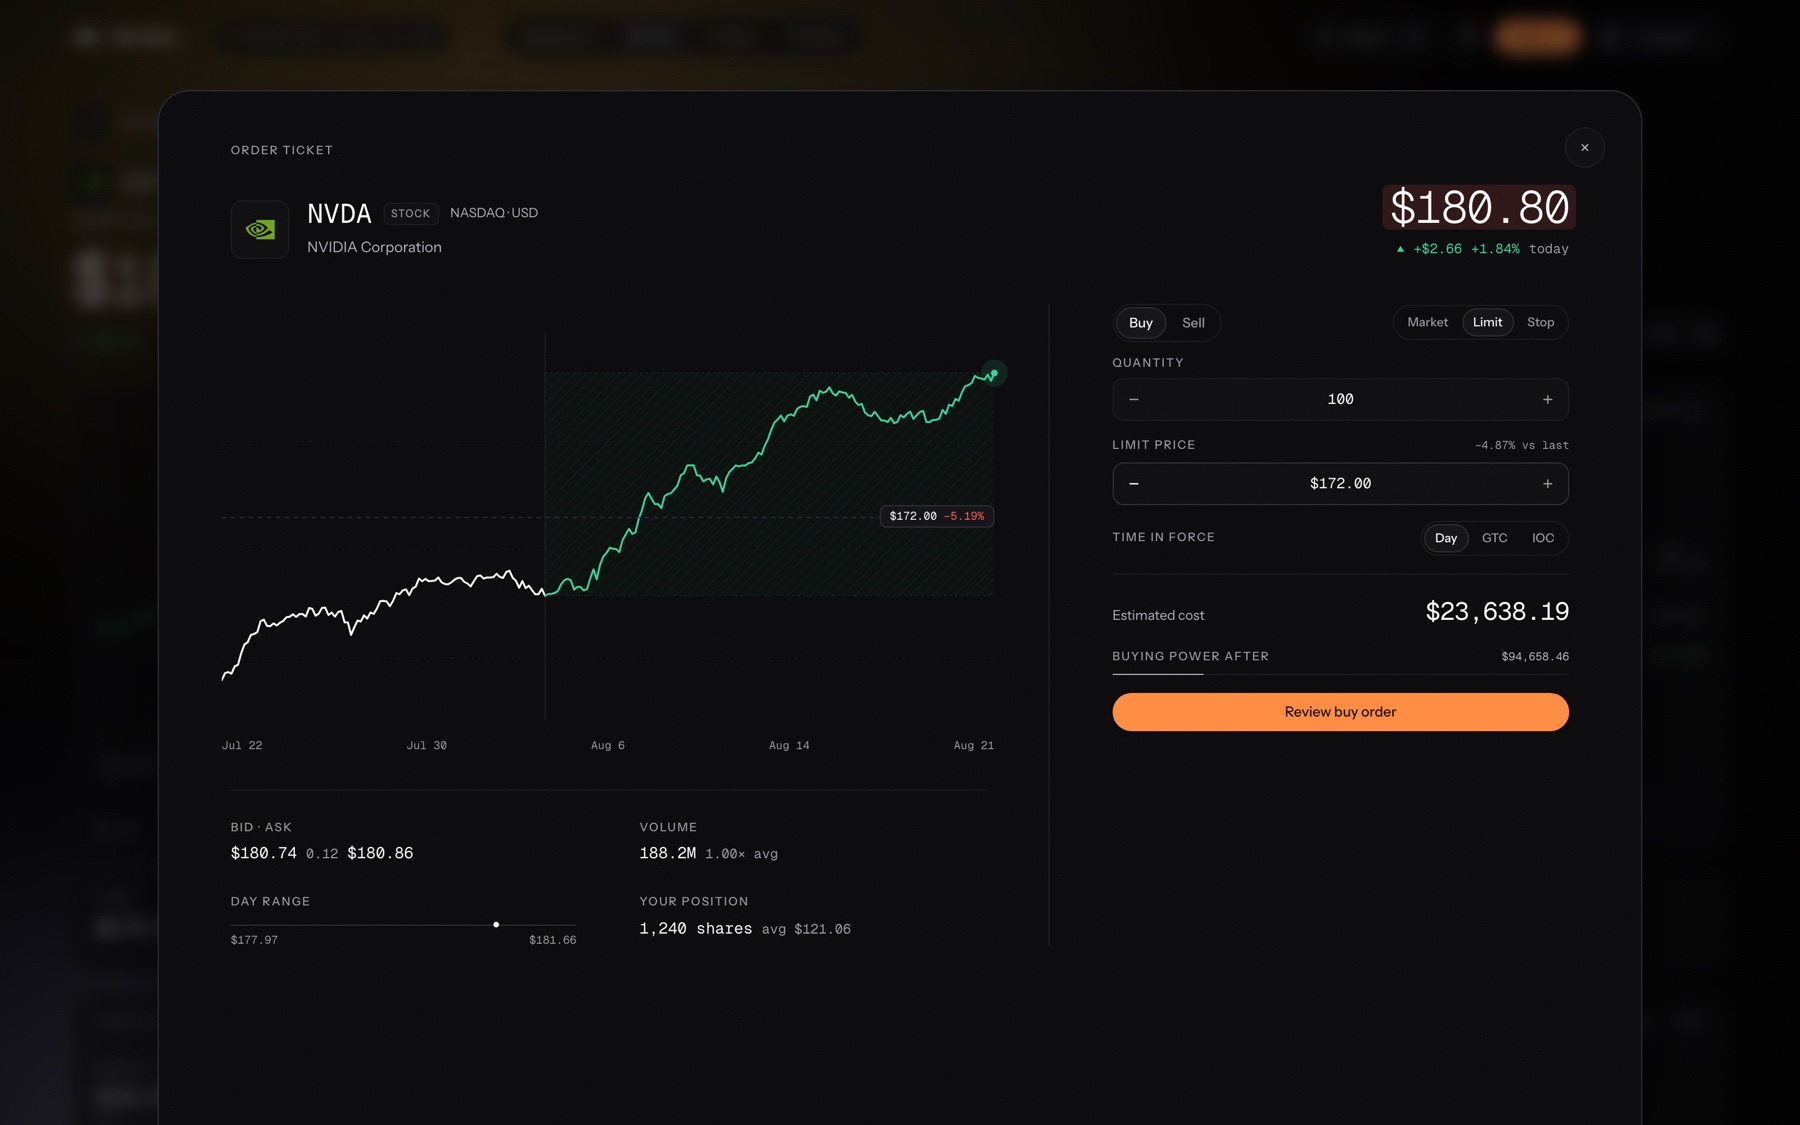
Buying does not happen in a dialog. The trade surface is a sheet that rises over the page, and the ticket is wired to the chart beside it: type a limit price and the level projects onto the chart, the distance from the last trade badged on the line. Placing an order stops being data entry and becomes aiming.
Aim. $172.00 against a last of $180.80 — the dashed level and the −4.87% badge are the ticket’s own number.
Placed. The order said in plain words, three facts, and the two things you might do next.
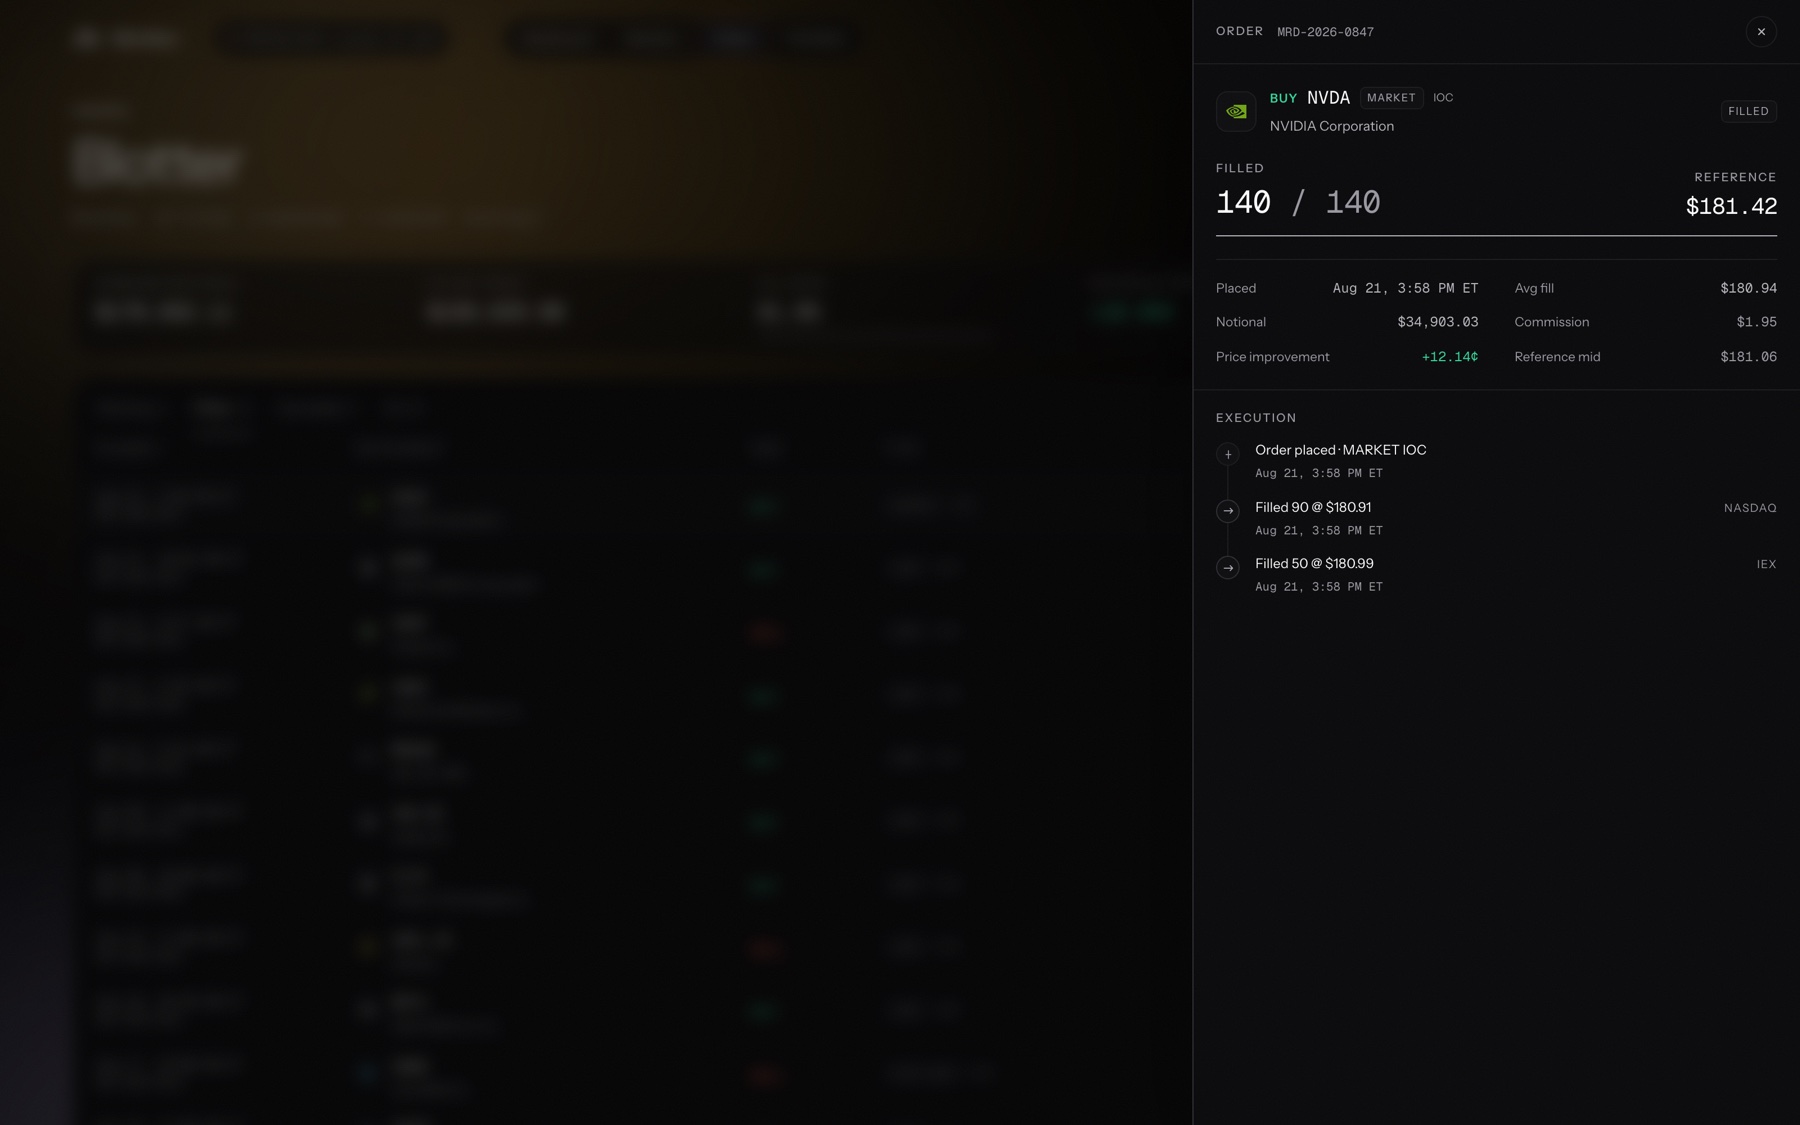
The receipt. 90 at $180.91 on NASDAQ, 50 at $180.99 on IEX — twelve cents of price improvement, itemised.
Design system
Aa Rr Gg
Instrument SansEverything that is language.$181.42
Geist MonoEvery numeral, without exception.0123456789
Tabular figuresSo a blotter’s decimals line up down the column.Logo design
A meridian is a line drawn from pole to pole — and the point in the day when something is at its highest. The mark is two arches meeting at a crown, reading as an M without being drawn as one. It draws itself in 1.1 seconds, and the grid is the rulebook.
Logo animation
Logo rules
Website
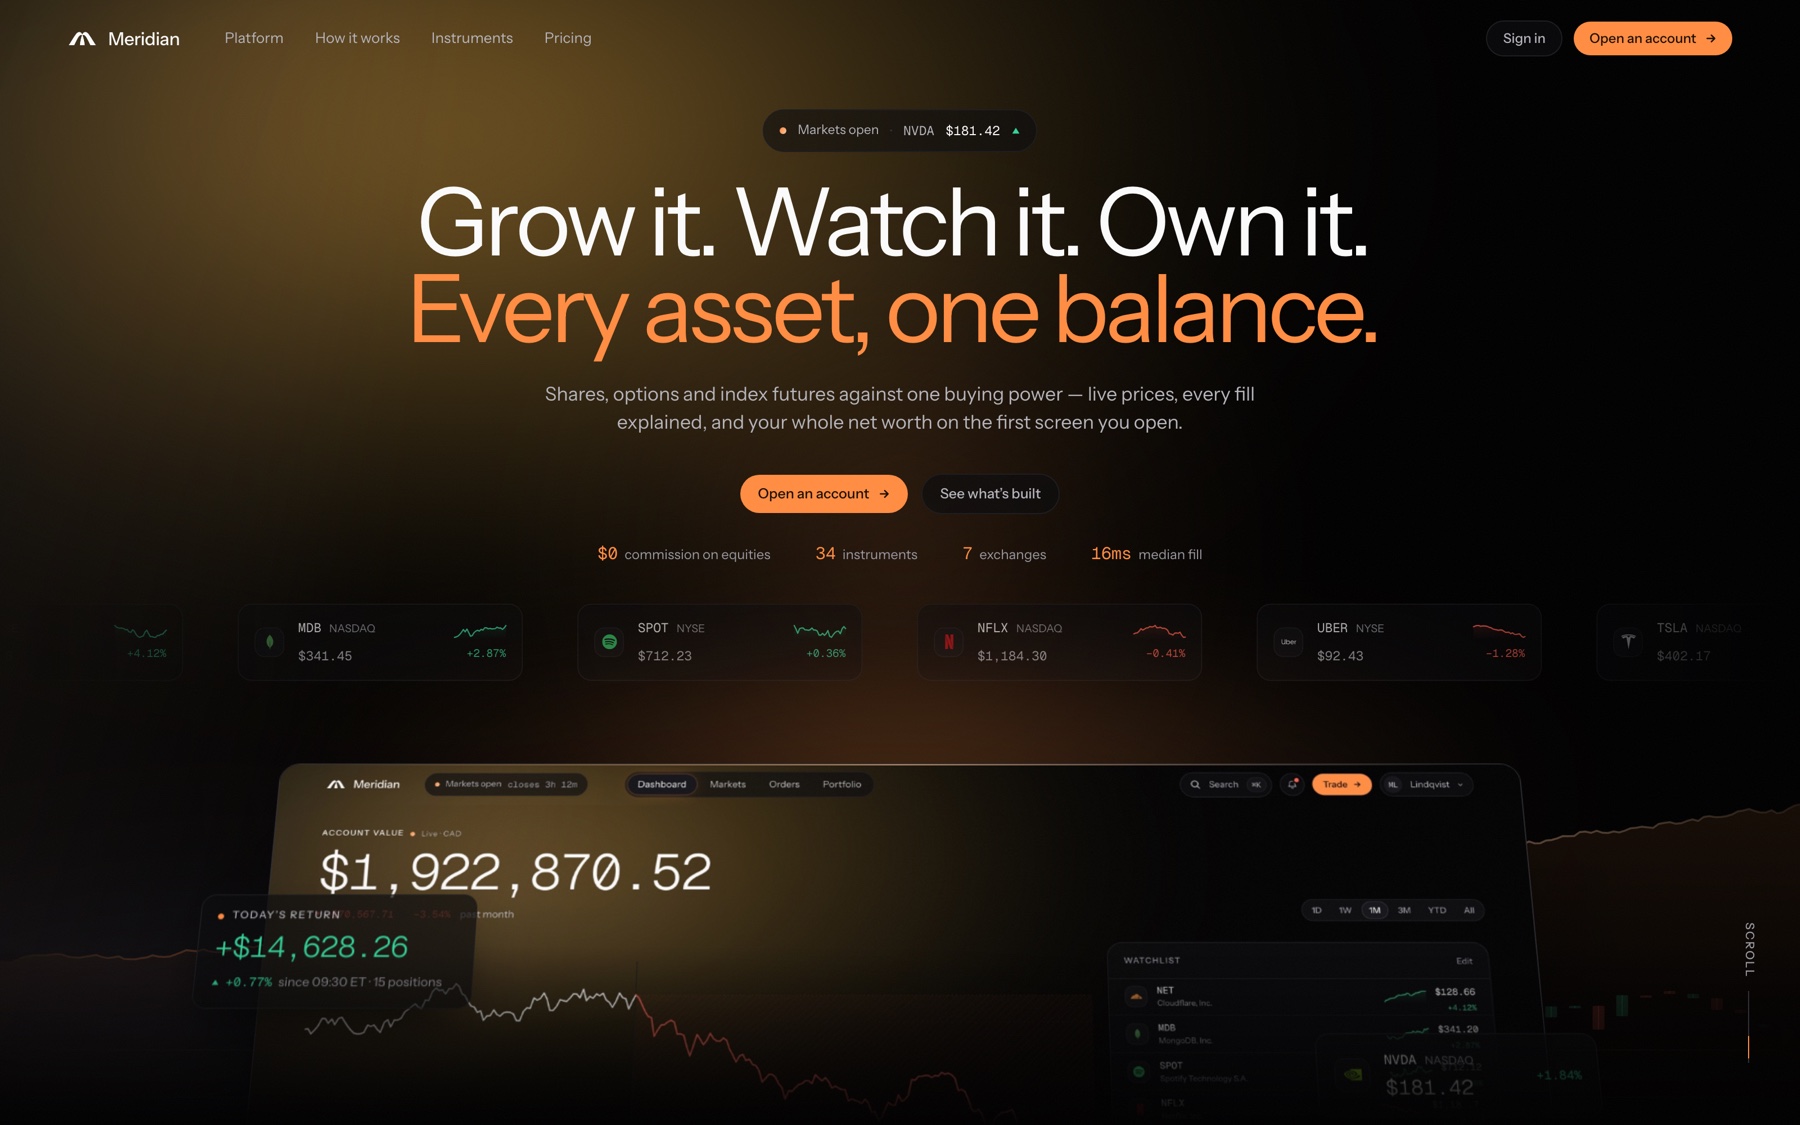
Check it liveThe marketing site had to sell the platform to people who cannot open it yet, so it is built out of the platform: the same ground, the same type, the same one accent, and real product frames instead of illustrations. One page — what it is, what it replaces, how it works in three steps, what it costs — ending on the same dark, quiet note the product opens on.
It went up before the product did, so the launch had somewhere to point.